


At work, I'm developing some projects that use NPM as a package manager. Starting from version 6, NPM will display short audit information at the end of an npm install execution in the following format:
found 290 vulnerabilities (283 low, 5 moderate, 2 high)
You can also get more detailed information. If you run npm audit you will receive explanations for each vulnerability and also some suggestions about how to fix that. For example:
# Run  npm update bl --depth 4  to resolve 1 vulnerability
┌───────────────┬──────────────────────────────────────────────────┐
│ High          │ Remote Memory Exposure                           │
├───────────────┼──────────────────────────────────────────────────┤
│ Package       │ bl                                               │
├───────────────┼──────────────────────────────────────────────────┤
│ Dependency of │ exceljs                                          │
├───────────────┼──────────────────────────────────────────────────┤
│ Path          │ exceljs > archiver > tar-stream > bl             │
├───────────────┼──────────────────────────────────────────────────┤
│ More info     │ https://npmjs.com/advisories/1555                │
└───────────────┴──────────────────────────────────────────────────┘
Supposedly, you are using some CI server for your project (and you should use one). Now think about this:
As your package manager automatically informs you about the vulnerabilities discovered in your dependencies, wouldn't it be awesome to receive this information on par with testing stats and linting reports on your CI server?
In this blog post, I will walk you through the process of capturing your npm audit output during a Jenkins build and using it for up-to-date information, trend overview, and quality gates.
⚠️Warning: the output format of
npm auditcompletely changed for NPM v7. Please consider reading my other blogpost, where I discuss the changes and suggest solutions for the new format.
The Scope
As you may have guessed already, we will talk about Jenkins here. If you are using another CI server, the Understanding the NPM Format section can be still useful for you, but everything else is indeed Jenkins-specific.
First of all, we are going to follow the declarative pipeline approach. It's a pity, that Jenkins still won't champion one of the approaches (at the moment Declarative Pipeline, Scripted Pipeline, and UI Config seem to be considered equally important). As the result, many libraries try to document how to use all the approaches, and as they don't have unlimited time, the documentations ends up being scarce. Based on extensive research I decided that Declarative Pipelines are the way to go, and I will stick to this decision throughout this blog.
Secondly, we are going to use the Warnings Next Generation plugin (a.k.a. Warnings NG). It seems to be the state of the art for static analysis reports at the moment. And yes, you need to have this plugin installed on your Jenkins server to get things working.
As the Warnings Next Generation plugin does not currently support the npm audit log format, we are going to overcome this issue by creating a custom groovy parser. There are other approaches like converting the output to a supported generic format or making a dedicated Jenkins plugin, and I may discuss these in the future. For now, the custom parser looks like the easiest way to get things going and all it requires are some changes to the build configuration.
Finally, I believe that even if your use case does not involve NPM, this blogpost can be useful for understanding how to implement custom groovy parsers for the Warnings NG plugin.
Understanding the NPM Format
As you may imagine, ultimately we will have to parse the npm audit output into something understandable by Warnings NG. Although we are going to discuss the parser setup in the next section, I will spoil you by revealing that the passing uses regular expressions exclusively.
The example output that I shared in the intro contains a table built with ASCI symbols. Such a format is tough to parse with a regex. Luckily there is a flag npm audit --parseable which will write every violation as a single line with values separated by tabs (for the sake of readability I replaced the tabs with aligned spaces in the following snippet):
update   bl       high      npm update bl --depth 4      Remote Memory Exposure  https://npmjs.com/advisories/1555  exceljs>archiver>tar-stream>bl          N
install  exceljs  moderate  npm install exceljs@4.1.1    Cross-Site Scripting    https://npmjs.com/advisories/733   exceljs                                 Y
update   lodash   low       npm update lodash --depth 9  Prototype Pollution     https://npmjs.com/advisories/1523  elasticsearch>lodash                    N
update   lodash   low       npm update lodash --depth 9  Prototype Pollution     https://npmjs.com/advisories/1523  exceljs>archiver>archiver-utils>lodash  N
Each line contains the following information in order:
- Action type required to resolve the issue;
- Name of the package with a vulnerability;
- Severity of the vulnerability;
- Resolution command/suggestion;
- Vulnerability category;
- Link to the vulnerability details;
- Dependency path;
- Y, N, or nothing. I don't know what that is :)
To write the regex, I've googled a first good regex testing website (regexr.com), pasted the audit output, and experimented. In the following screenshot you can see from top to bottom:
- the resulting regex with a highlighted group that I'm investigating;
- the example output I used for testing with one highlighted line that I'm investigating;
- the breakdown of the match groups in the highlighted line, with one group highlighted which corresponds to the highlighted part of the regex.
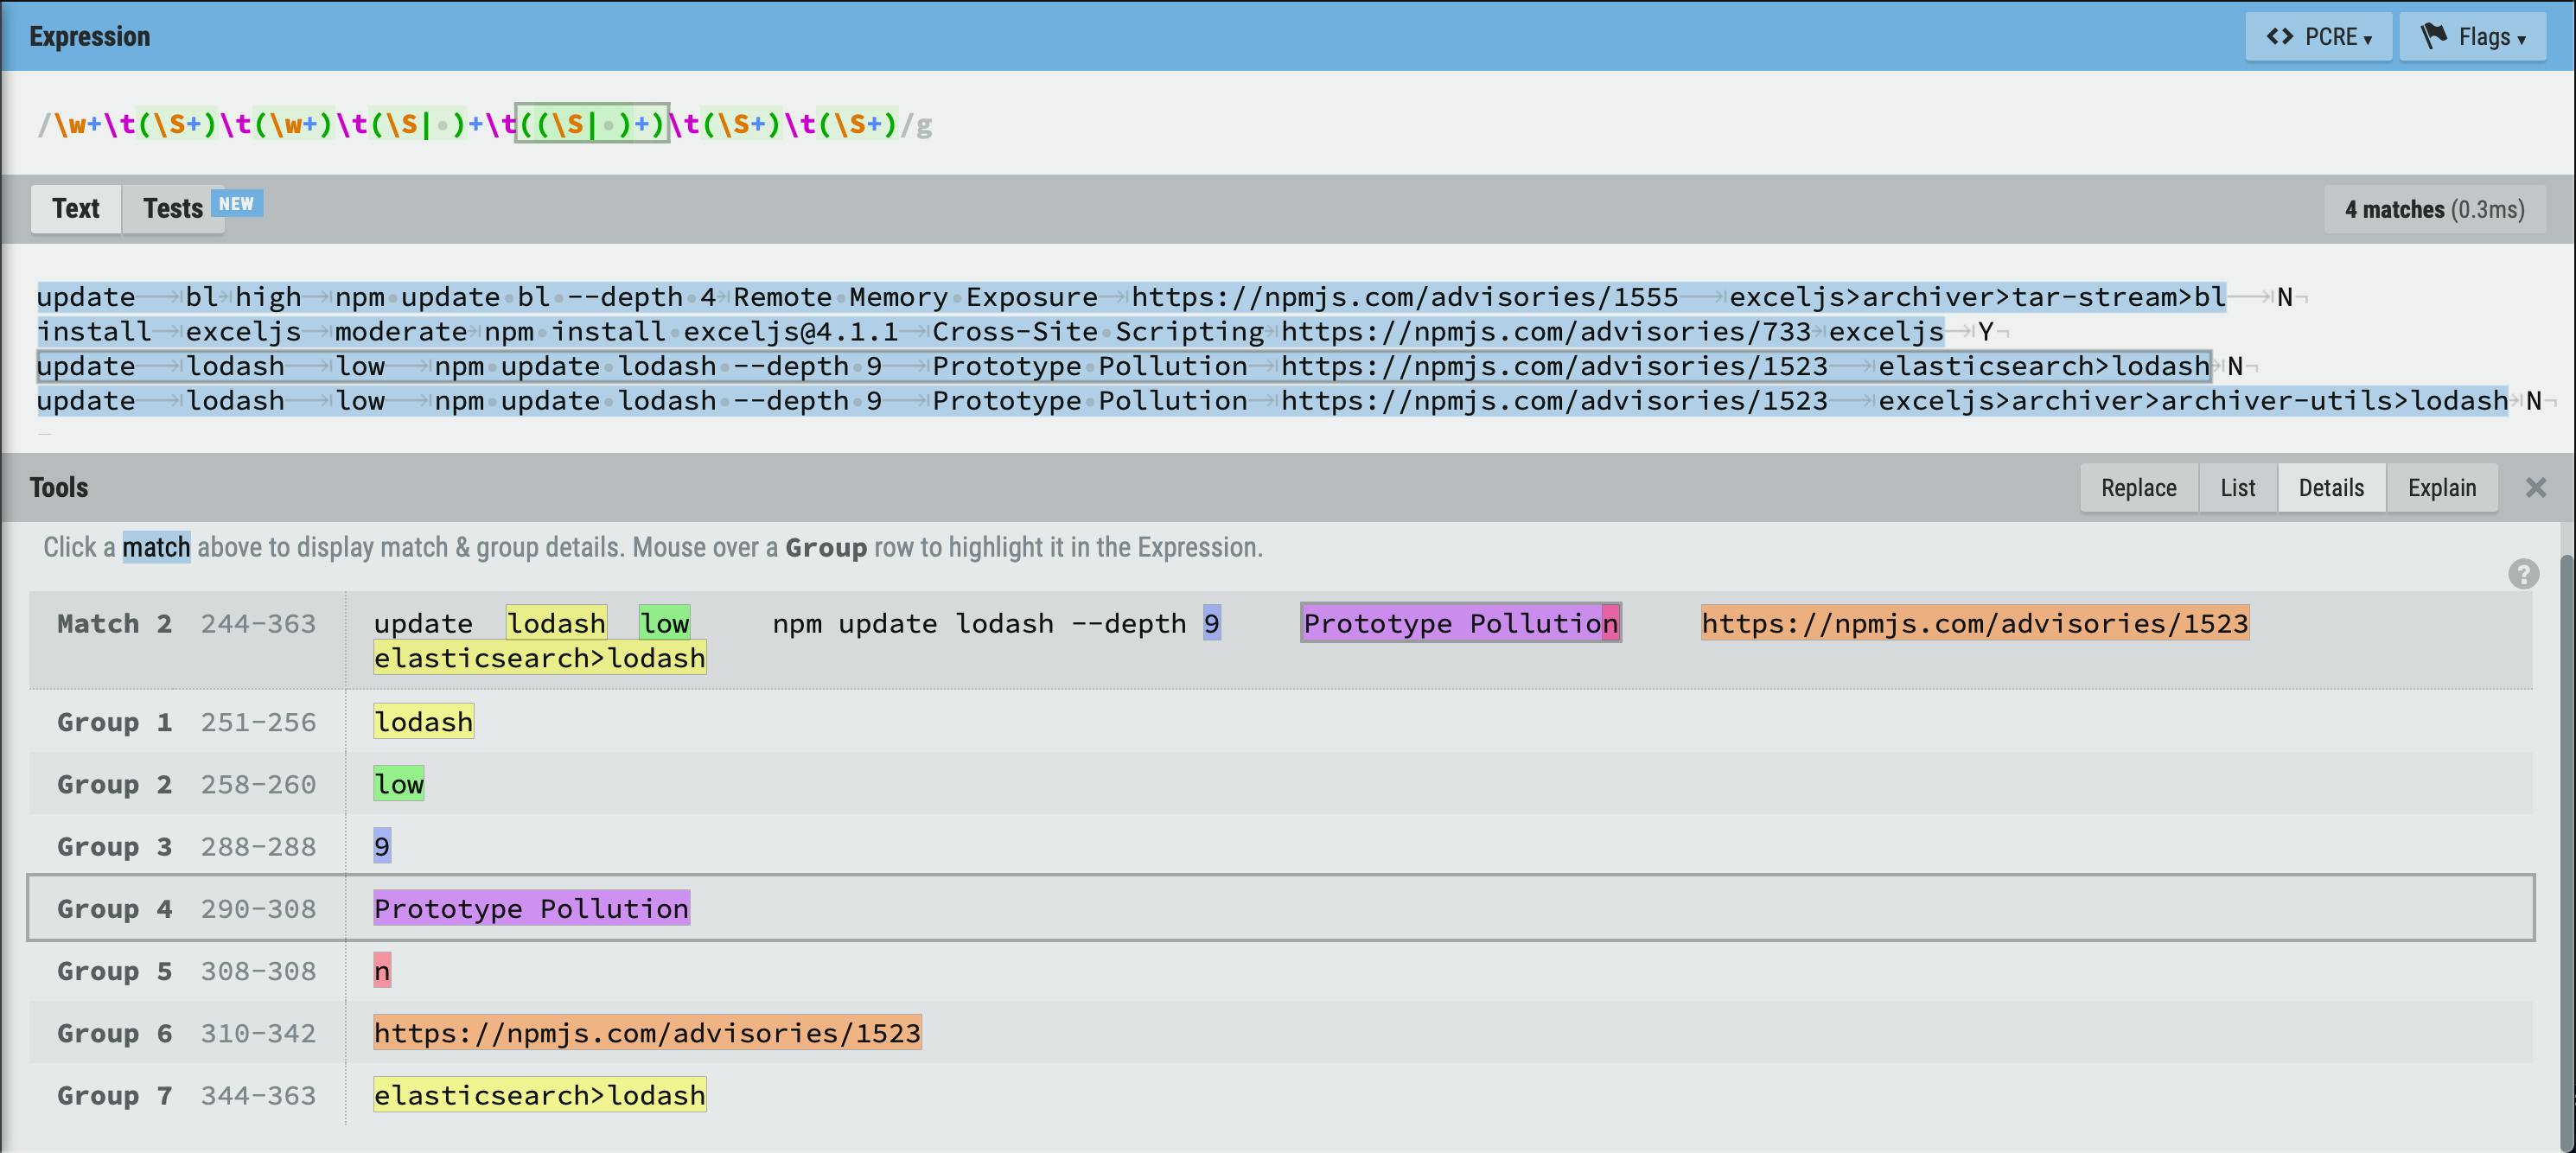
As you could see, the resulting regex is:
\w+\t(\S+)\t(\w+)\t(\S| )+\t((\S| )+)\t(\S+)\t(\S+)
Here is a small explanation of important regex matching patterns:
\t— a tab character;\w— an alphanumerical character;\S— a non-whitespace character;(\S| )— a non-whitespace character or a space;\w+— one or many alphanumerical characters;\S+— one or many non-whitespace characters;(\S| )+— one or many non-whitespace or space characters.
You can (and should in this case) use parenthesis to define "capture groups." These are parts of the regex that can be accessed once a match is found. Sometimes you have to use parenthesis (as in (\S| )+ to define that + applies to the whole "or" group). There are ways to ignore a certain parenthesis as a match group (so you can avoid pollution by necessary parenthesis) but we are not going to discuss this now.
Also the whole regex can be described as: ((\S| )+)\t repeated eight times without the last \t. The whole line is composed of blocks of one or many non-whitespace or space characters followed by a tab. But I tried to be smart and use some simpler constructs where I was sure about the format of some parts.
Creating a Custom Groovy Parser
At this point, we are going to jump directly into our Jenkins (declarative) pipeline. This assumes that we have a Jenkinsfile that describes a build pipeline composed of several stages. With my approach, all that you have to do is just to add one more stage for auditing. It will look the following way:
stage('NPM Audit') {
    steps {
        script {
            // set up the parser
        }
        sh 'mkdir -p .tmp/npm'
        sh 'npm audit --parseable > .tmp/npm/audit || true'
    }
    post {
        always {
            // record issues
        }
    }
}
We will spend the majority of this section to set up the parser, but let's take a quick look at the code that runs the auditing. First of all, don't forget to crate a temp directory where you are going to store the auditing log. Secondly, run the audit with the --parseable flag and write it into a temporary file with a unique name. As you can see, at the end of the command I have || true which will ensure that the step will not fail. Normally when npm audit finds some vulnerabilities it exits with a non-zero code and thus fails the stage. I prefer to control how the stage fails with the quality gates of Warnings GN, and I will discuss this later. There is another option to specify the --audit-level=critical flag which will fail the step only if there are critical vulnerabilities (and probably you want to fail your build if you have one of those). Never the less, I prefer to handle all the vulnerabilities with Warnings GN. The downside of || true is that the stage will not fail even if the npm audit command fails to run at all (e.g., if package.json is missing).
Defining the Parser
Based on the documentation, you should set up a parser with the following command:
def config = io.jenkins.plugins.analysis.warnings.groovy.ParserConfiguration.getInstance()

if(!config.contains('npm-audit')){
    def newParser = new io.jenkins.plugins.analysis.warnings.groovy.GroovyParser(
        'npm-audit',
        'NPM Audit Parser',
        '\w+\t(\S+)\t(\w+)\t(\S| )+\t((\S| )+)\t(\S+)\t(\S+)',
        'return builder.setFileName(matcher.group(7)).setCategory(matcher.group(4)).setMessage(matcher.group(6)).buildOptional()',
        "update\tlodash\tlow\tnpm update lodash --depth 9\tPrototype Pollution\thttps://npmjs.com/advisories/1523\telasticsearch>lodash\tN"
    )
    config.setParsers(config.getParsers().plus(newParser))
}
Let's focus on the actual parser for now. We create a parser by calling the constructor of GroovyParser. The first two parameters are id and name. The id is a technical label used to identify your parser in the future, the name is what you are going to see in the Jenkins UI. Then comes the regex, which is identical to what we discussed in the previous section. The fourth parameter is the script which is going to create Warnings NG issues from the parsed out tokens, and the last one is the example line of what you are trying to parse (for documentation purposes).
Now let's look at the issue-building script in more detail. Essentially, you are using the issue builder API and passing the matched regex groups. To figure out the groups more easily, just look at the regex website again. Here is the list of all the building methods that we used:
setFileName(matcher.group(7))— this literally sets the filename where the issue was found. Warnings NG will try to search for this file in your source code and will fail in our case (because we have packages and not actual files). Here I pass the package dependency path, so for each vulnerability, you have a clear notion of where it comes from. Another option is to use the package name, but if there are 100 reported vulnerabilities because many packages depend on a faulty version oflodashthen 99 warnings will be discarded as duplicates. In case of the former option, each reported dependency path is different, and Warnings NG will treat them as different files;setCategory(matcher.group(4))— sets the category for the warning. Here the choice is obvious and I pass the vulnerability category;setMessage(matcher.group(6))— this sets the description of the issue in case you want to read details about it. I choose to set the link to the detailed vulnerability description, but you may find the resolution command to be more useful. There are no mandatory values, choose what is better for you.
These are the recommended parameters. Recommended by the sparse official documentation. If you dig deeper and dive into the source code of the Jenkins Plugin and its dependencies, you can find there the rest of the issue builder API:
Setting and Resetting the Parser
Now it's time to make the parser accessible by our Jenkins steps. Let's look closer at the code that surrounds the definition of the parser:
def config = io.jenkins.plugins.analysis.warnings.groovy.ParserConfiguration.getInstance()

if(!config.contains('npm-audit')){
    def newParser = // define the parser
    )
    config.setParsers(config.getParsers().plus(newParser))
}
First, we get the config, and only if there is no parser with the same id, we create and add the new parser to the parser list. This is a very correct implementation suggested by the official documentation as you don't want to accidentally override an existing parser.
However, the parsers persist between build jobs, so if you want to modify your parser, there is no way with the current script. Even if you remove the if(!config.contains('npm-audit')){ guard, it will not work. I suppose, that the parser with the same id is simply appended, and the one that comes first (your previous parser) will be selected upon request.
So when you want to replace an existing parser, you should use the following code:
def config = io.jenkins.plugins.analysis.warnings.groovy.ParserConfiguration.getInstance()
def newParser = // define the parser

def parsers = config.getParsers().findAll { it.getId() != 'npm-audit' }
config.setParsers(parsers.plus(newParser))
This code will remove all existing parsers with id npm-audit and add our own parser. So be careful and don't use the id of an existing system parser 😜.
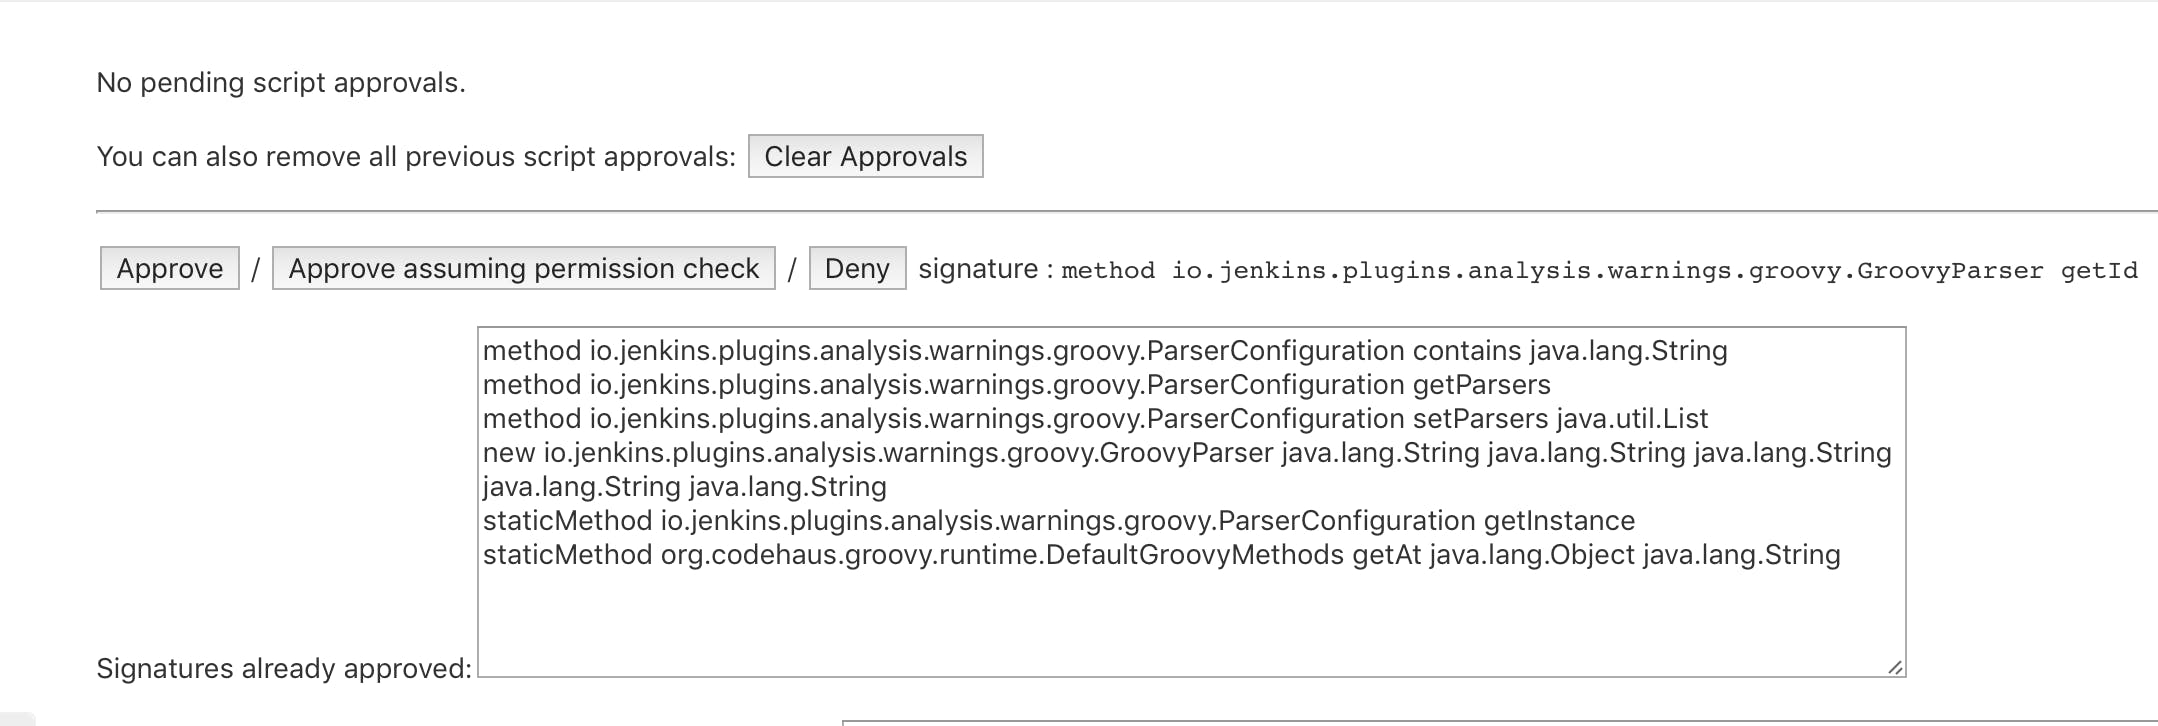
Pay attention ‼️ your jobs will most likely fail with such error:
Scripts not permitted to use method io.jenkins.plugins.analysis.warnings.groovy.ParserConfiguration getParsers. Administrators can decide whether to approve or reject this signature.
[Pipeline] End of Pipeline
[Bitbucket] Notifying commit build result
[Bitbucket] Build result notified
[Checks API] No suitable checks publisher found.
org.jenkinsci.plugins.scriptsecurity.sandbox.RejectedAccessException: Scripts not permitted to use method io.jenkins.plugins.analysis.warnings.groovy.ParserConfiguration getParsers
    at org.jenkinsci.plugins.scriptsecurity.sandbox.whitelists.StaticWhitelist.rejectMethod(StaticWhitelist.java:265)
    at org.jenkinsci.plugins.scriptsecurity.sandbox.groovy.SandboxInterceptor.onMethodCall(SandboxInterceptor.java:161)
    at org.kohsuke.groovy.sandbox.impl.Checker$1.call(Checker.java:161)
    at org.kohsuke.groovy.sandbox.impl.Checker.checkedCall(Checker.java:165)
    .
    .
    .
This is a Jenkins safeguard that disallows generic scripts to use core functionality (such that some third party can't delete the whole file system or perform other malicious actions). But you know what you are doing, right? In this case, you have to either click the Administrators can decide whether to approve or reject this signature hyperlink or go to Jenkins > Manage Jenkins > In-process Script Approval and allow the script under question.
Consuming the NPM Audit Report
This should be done in the post part of our audit Jenkins stage, and the code is relatively simple:
post {
    always {
        recordIssues(
             tool: groovyScript(parserId: 'npm-audit', pattern: '.tmp/npm/audit'),
                qualityGates: [
                    [threshold: 100, type: 'TOTAL', unstable: true]
                ]
        )
    }
}
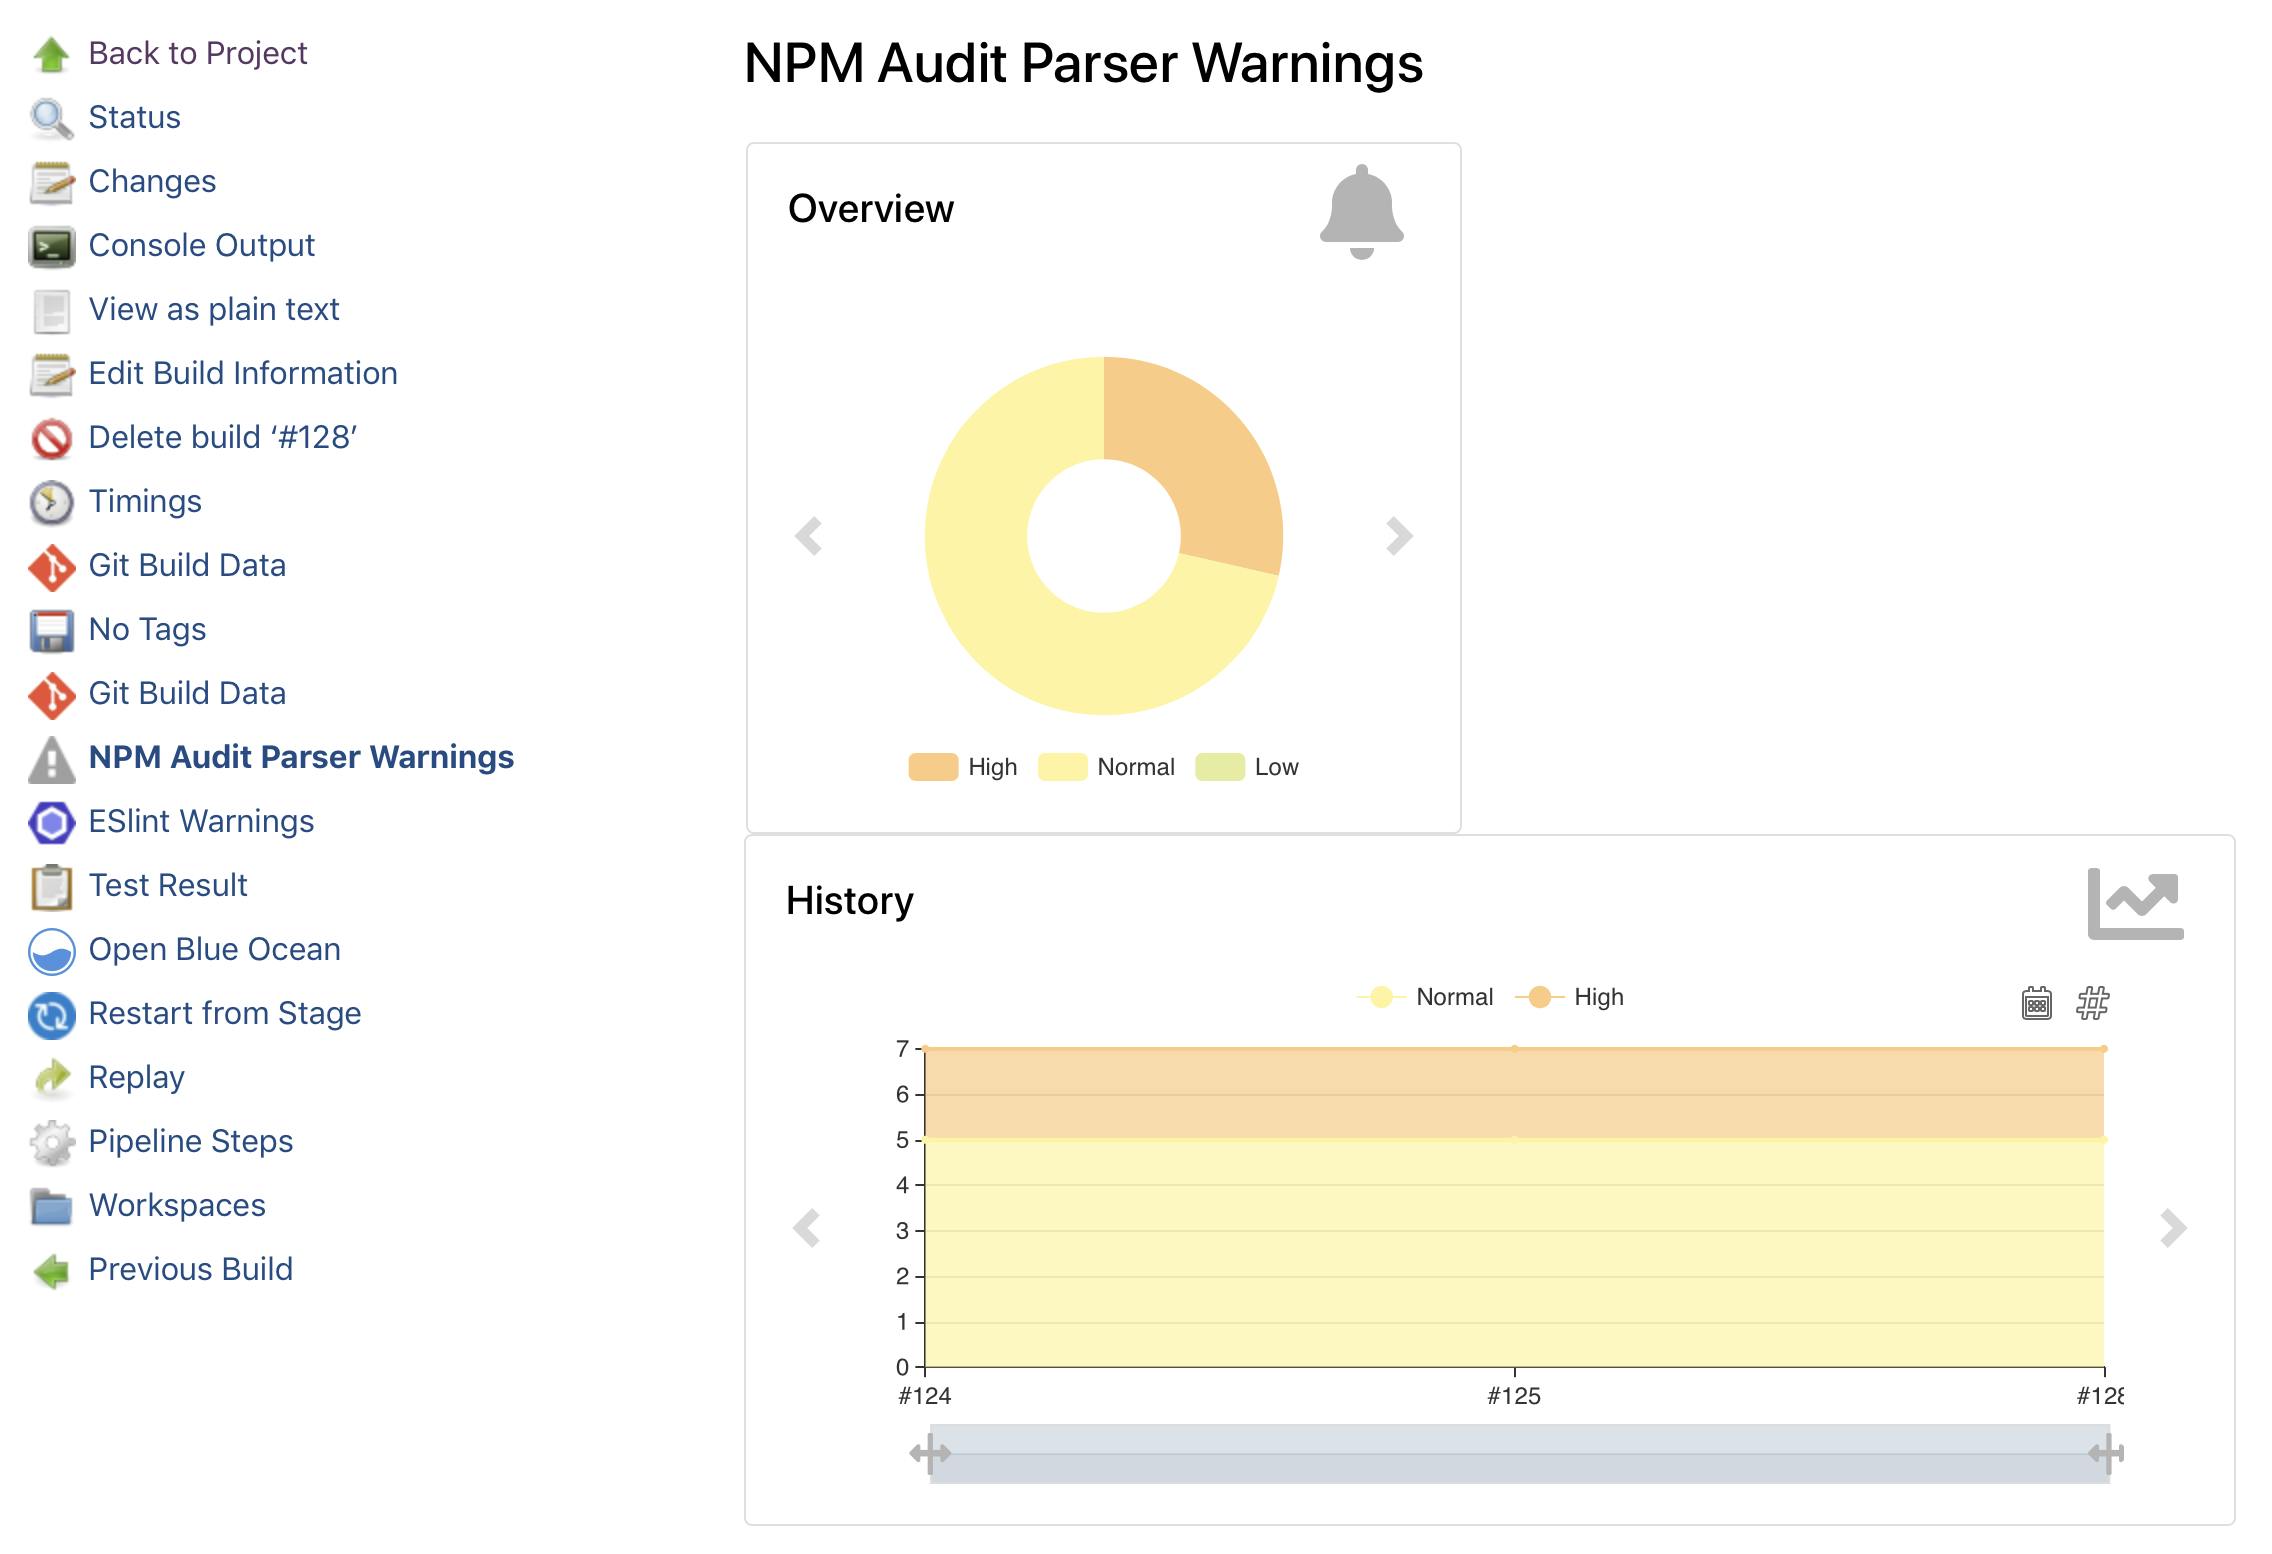
Just specify your parser's id and the file which contains the stored audit log. After this step, your Jenkins build pages will display the trend of npm audit warning, and provide more details on a dedicated page.
Look at the previous snippet again. In that example, I also define a quality gate that marks the build as unstable when the total number of the NPM audit reports is more than 100. The rationale is that you would see the trend anyway on your Jenkins dashboard. I would say that if you have 1 or 2 new warnings eventually it's ok, but when it's too much, you should really do something. You can also use unstable: false if you want to fail the build instead of marking it unstable. Regarding types, you have many choices for both threshold type (all, new, delta) and warning types (low, normal, warning, error). As it was previously: if you want to know all the options, check the enum QualityGateType values in the source code (yes, I spent a lot of time to find it, so you don't have to suffer):
Final Code Snippet
stage('NPM Audit') {
    steps {
        script {
            def config = io.jenkins.plugins.analysis.warnings.groovy.ParserConfiguration.getInstance()
            def newParser = new io.jenkins.plugins.analysis.warnings.groovy.GroovyParser(
                'npm-audit',
                'NPM Audit Parser',
                '\w+\t(\S+)\t(\w+)\t(\S| )+\t((\S| )+)\t(\S+)\t(\S+)',
                'return builder.setFileName(matcher.group(7)).setCategory(matcher.group(4)).setMessage(matcher.group(6)).buildOptional()',
                "update\tlodash\tlow\tnpm update lodash --depth 9\tPrototype Pollution\thttps://npmjs.com/advisories/1523\telasticsearch>lodash\tN"
            )
            def parsers = config.getParsers().findAll { it.getId() != 'npm-audit' }
            config.setParsers(parsers.plus(newParser))
        }

        sh 'mkdir -p .tmp/npm'
        sh 'npm audit --parseable > .tmp/npm/audit || true'
    }
    post {
        always {
            recordIssues(
                tool: groovyScript(parserId: 'npm-audit', pattern:'.tmp/npm/audit'),
                qualityGates: [
                    [threshold: 100, type: 'TOTAL', unstable: true]
                ]
            )
        }
    }
}
Bonus: Setting the Severity
Ok, look, this is definitely an overkill for this approach, but I want to show you how Groovy scripts can be abused (I learned this by reading Warnings NG source code). You can change our previous script:
"return builder.setFileName(matcher.group(7)).setCategory(matcher.group(4)).setMessage(matcher.group(6)).buildOptional()"
into a full-fledged multi-line and multi-statement implementation:
"""
    import edu.hm.hafner.analysis.Severity
    Severity severity
    switch(matcher.group(2)) {
        case 'low':
            severity = Severity.WARNING_LOW;
            break;
        case 'moderate':
            severity = Severity.WARNING_NORMAL;
            break;
        case 'high':
            severity = Severity.WARNING_HIGH;
            break;
        case 'critical':
            severity = Severity.ERROR;
            break;
        default:
            severity = Severity.WARNING_NORMAL;
            break;
    }
    return builder
        .setFileName(matcher.group(7))
        .setCategory(matcher.group(4))
        .setMessage(matcher.group(6))
        .setSeverity(severity)
        .buildOptional()
"""
One thing to notice here are triplets of double-quotes that wrap the string with line breaks. Another confusing thing can be the Severity severity line, but this is just a severity variable definition (and it has the Severity type). In this script, we simply use the switch statement, and based on the value of the second match group we set one of the predefined severity values. In this code, I use all the severity possibilities, but you can check this yourself just by reading the Severity class definition:
Now as we have warnings of various severities, we can add one more quality gate, so our post section will look like this:
post {
    always {
        recordIssues(
            tool: groovyScript(parserId: 'npm-audit', pattern:'.tmp/npm/audit'),
            qualityGates: [
                [threshold: 100, type: 'TOTAL', unstable: true],
                [threshold: 1, type: 'TOTAL_ERROR', unstable: false]
            ]
        )
    }
}
This will keep marking a build as unstable if it has more than 100 warnings in total, but it will also fail the build if it has any warnings of the ERROR level which is called critical in the npm terminology.
Of course, you can use the same approach to put more logic into the issue creation and combine multiple parse groups into a single warning message, but I feel like other approaches are more suitable for that.
If you want to learn more, consider reading my second blog post in this series where I describe another approach by employing issues in native JSON format:
Also, take a look at the upcoming breaking changes in NPM v7: